
This systematic approach uses MS-Excel 365 to manage a Portfolio of instruments sold via any stock exchange, and used to produce a regular dividend income.
IMPORTANT: Always start with the Portfolio Aim. Why are we investing? (income generation, capital growth, preservation of capital).
What do we hope to achieve out of it?
It is worth giving this some thought and refining this over time. Try to be as specific as possible.
Consider using SMART Criteria

This Portfolio Aim can be further refined into a set of criteria to follow. This helps to remove emotion from the decision making process.
It is far better that you decide yourself, which crieria to select. Then simply FOLLOW them.
There are various methods you can use to find Stocks, ETFs or Bonds that meet your criteria:
It is strongly recommended to use multiple data sources and check them against each other.
Sometimes there are errors and there are several different ways to calculate P/E ratio, Dividend Yield or "current year" Dividend forecast (some use calendar year, financial year or last 2 dividends).
Using Excel's Power Query Editor, we have imported and extracted only those fields in which we are interested from the ASX Workbook:

It is impractical to closely follow and read all the news about all instruments on one Stock Exchange (let alone multiple Stock exchanges). Instead, we use the technique described above to limit those stocks that meet our Criteria.
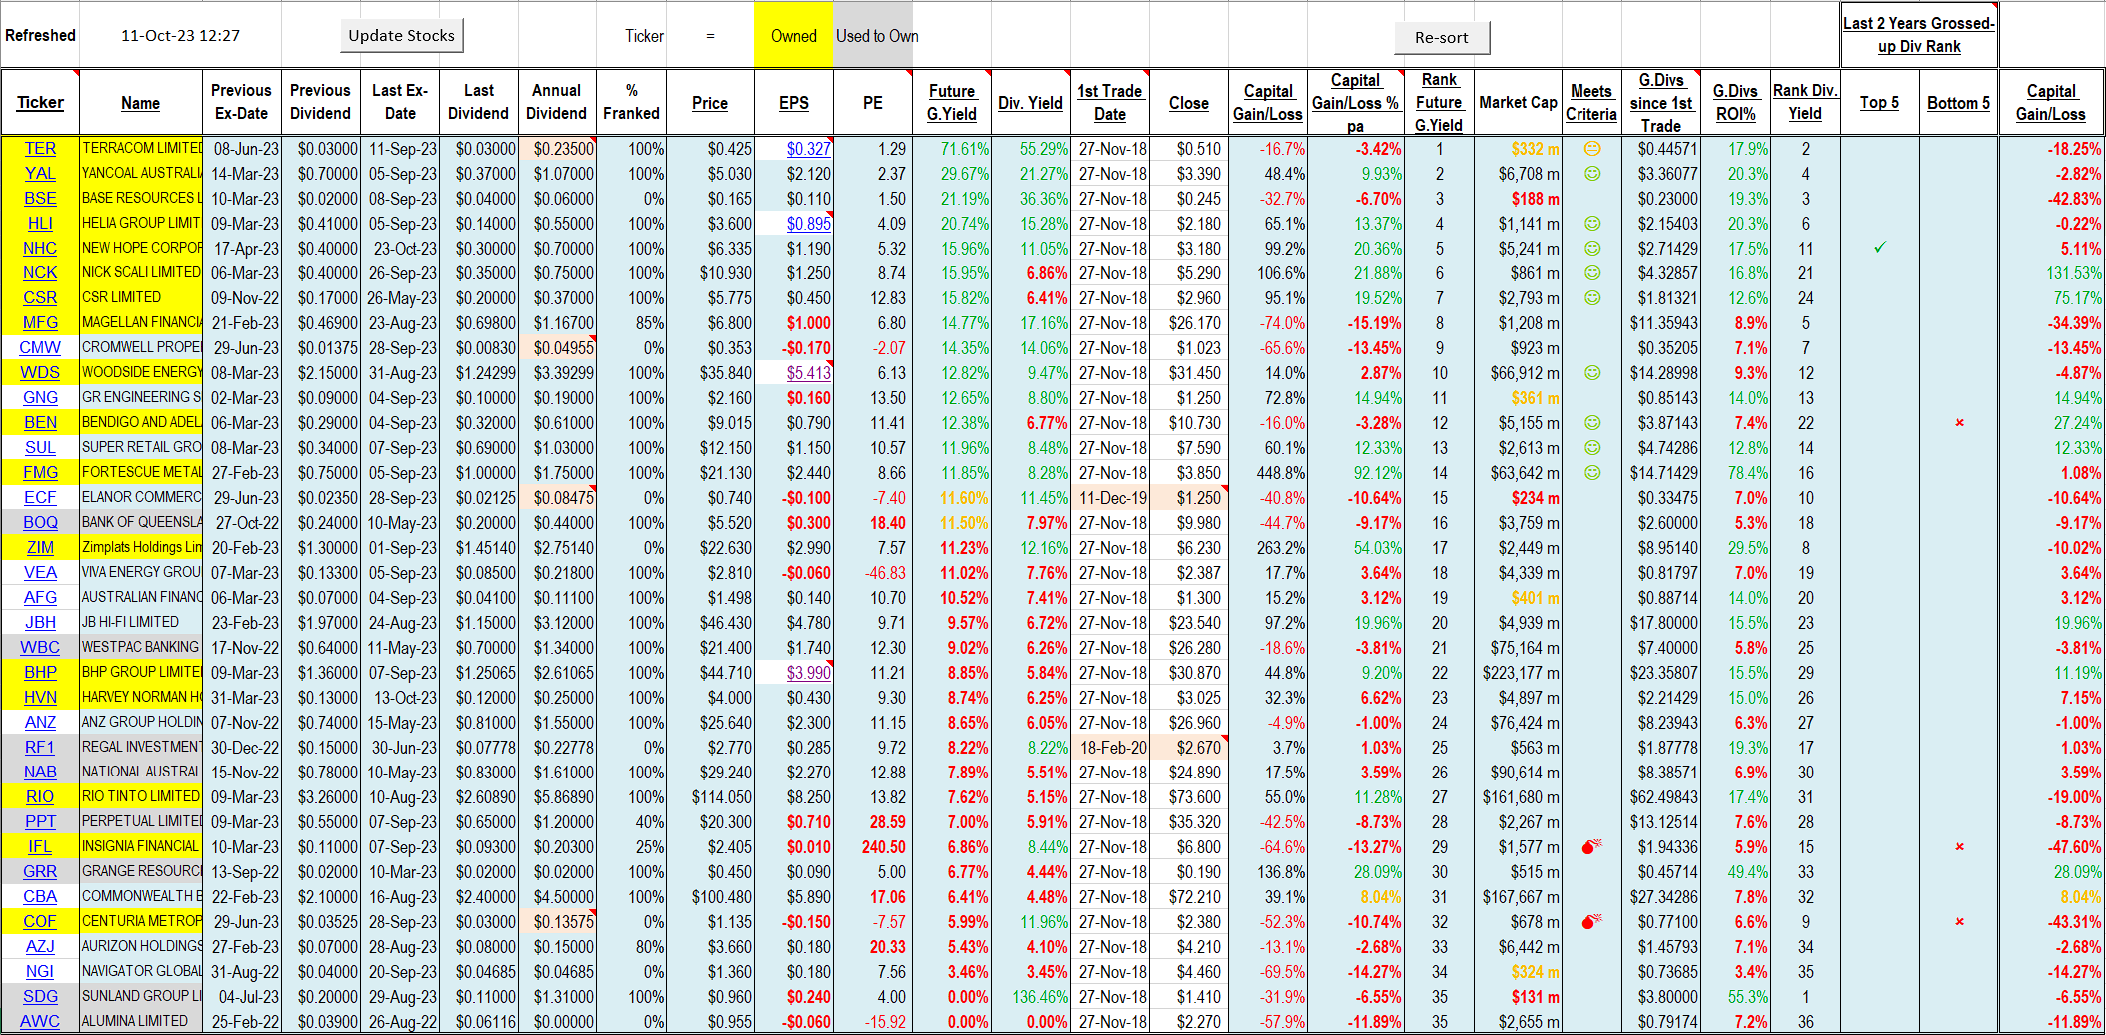
In the figure below, the shares or ETFs on our "radar" are firstly ranked by Future Grossed-up Dividend (Future G.Yield) and then sorted by this rank (Rank Future G.Yield).
"Grossed-up" = a term specific to Australian shares owned by residents. It includes basic Dividend + Franking Credits.
Because the percentage of Franking Credits can vary from company to company, it is important to compare them on an apples-to-apples basis, using their respective Grossed-up Dividends.
The "Meets Criteria" column helps decide whether to invest (or buy more) of a particular stock and when to dump it and recycle the capital into an investment with a better Grossed-up Dividend yield.
Note: Once an instrument is chosen, it remains on the "radar" permanently (unless delisted), even though we may have sold all of it.
The colour-coding below indicates shares that we own vs. used to own vs. have not bought yet.
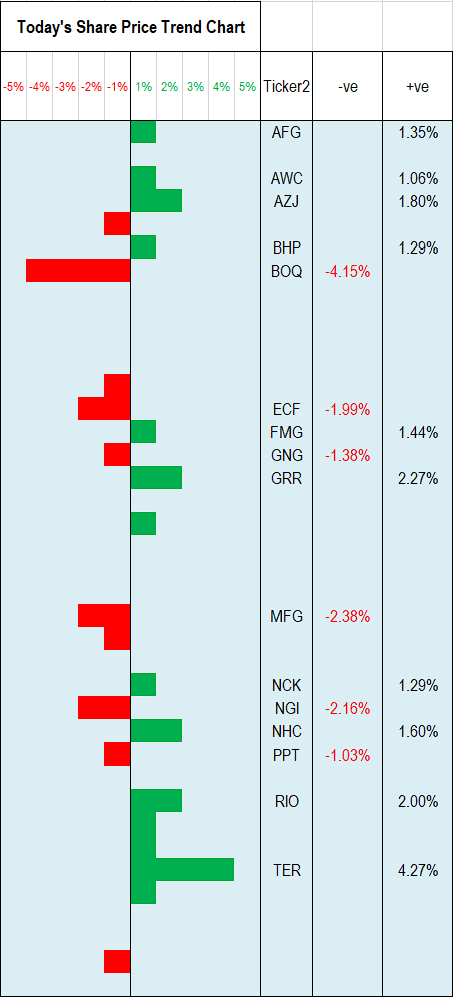
At times you may acquire additional funds to invest by some means, such as SELLing under-performing shares, etc.
The trigger to BUY new shares is usually immediately after a Dividend announcement. After entering a Dividend into the system, it suggests which shares to BUY, how many and when.
The BUY order is placed between the date of the Dividend announcement and the impending Ex-date, meaning we have maximum certainty.
The amount of shares to BUY is based on your risk appetite, for example, we use a set percentage of total Portfolio:

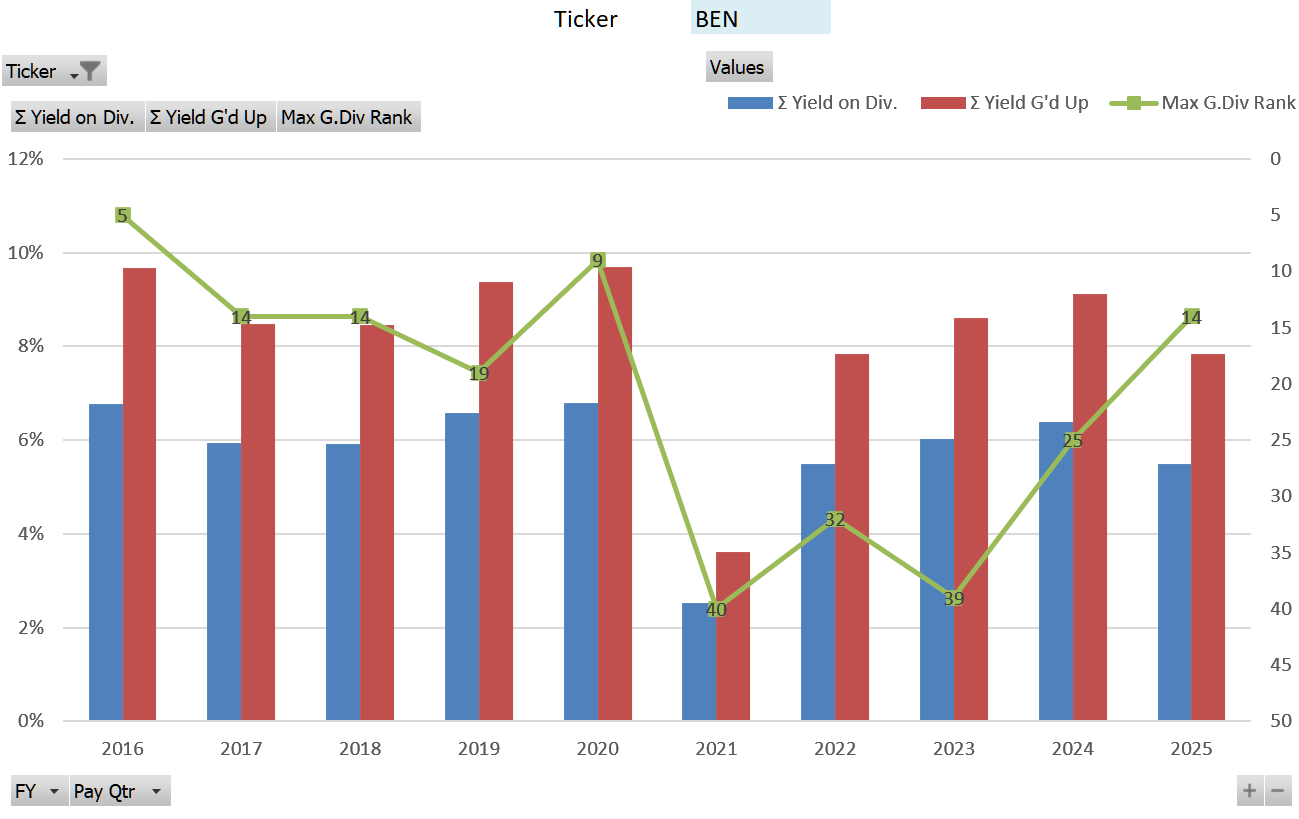
This is also a unique way of evaluating stocks. Instead of just the varying Share Price, we look at Dividend Yield % (Dividend in dollars divided by Share Price on the eve of the Ex-date), plotted over time using an Excel Pivot Chart.
We are primarily looking for consistency or better still, an upward trending line.
TBA
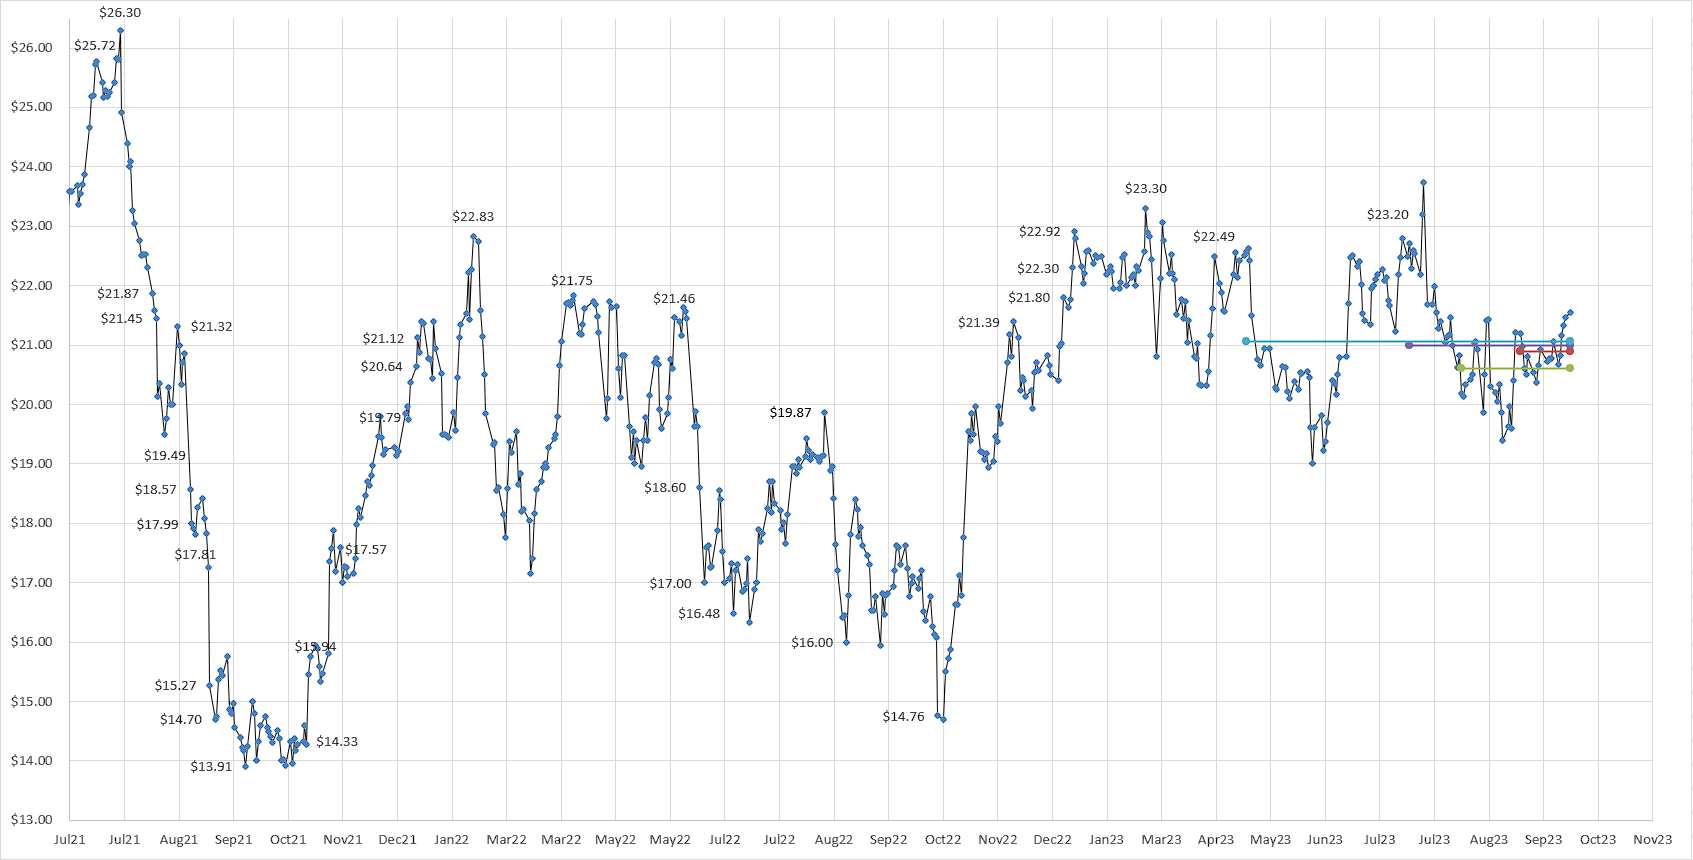
The following Excel chart replicates Price charts you can find anywhere on the Web or your broker's web site, however we have added different coloured lines for averages: 6-month, 3-month, 2-month and 4-week.
This can be useful when it is time to BUY or SELL.
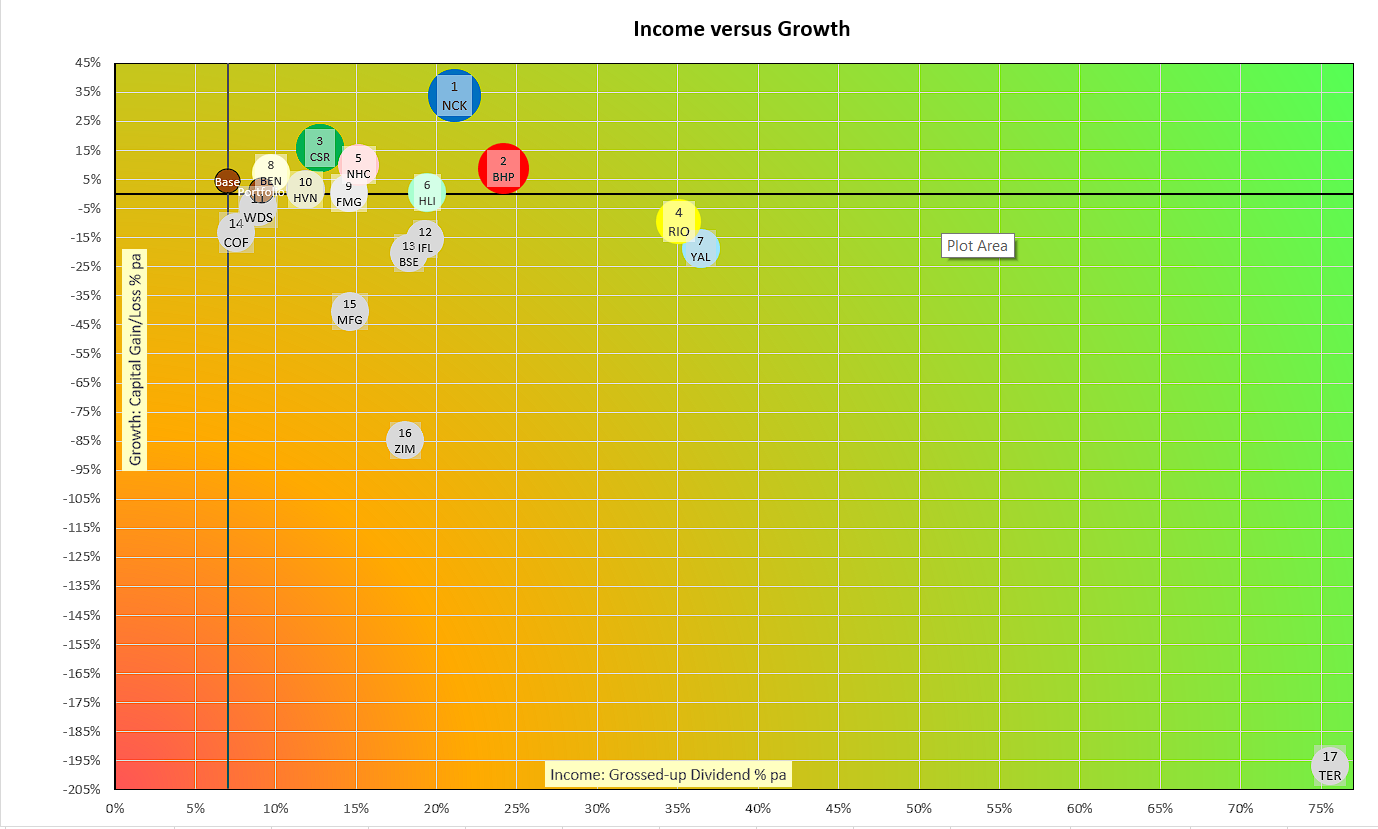
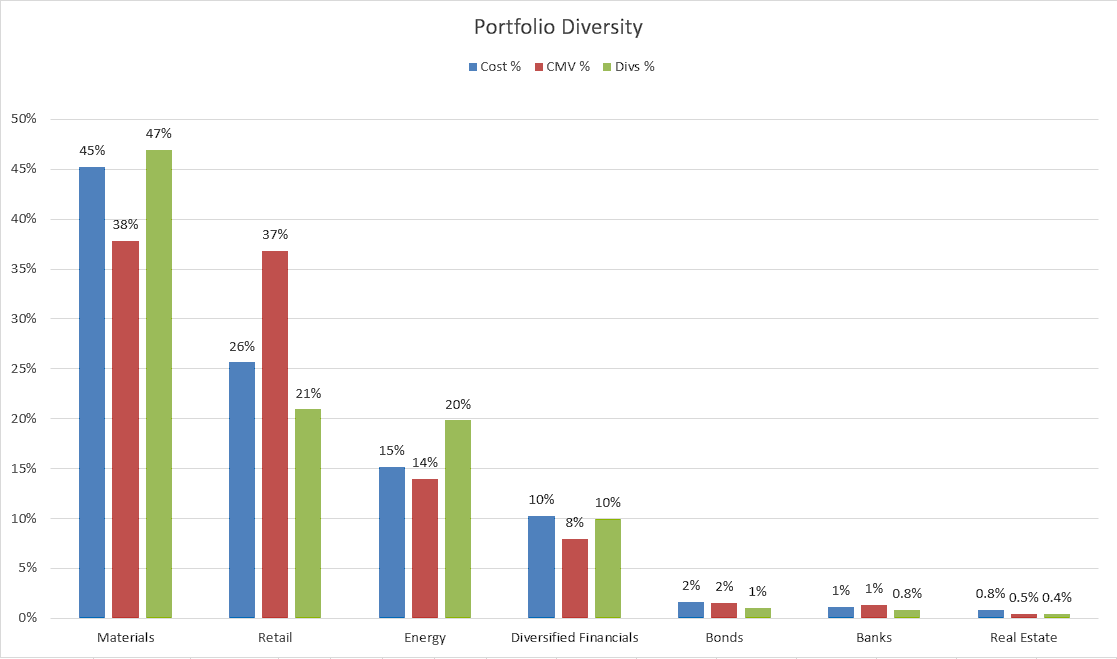
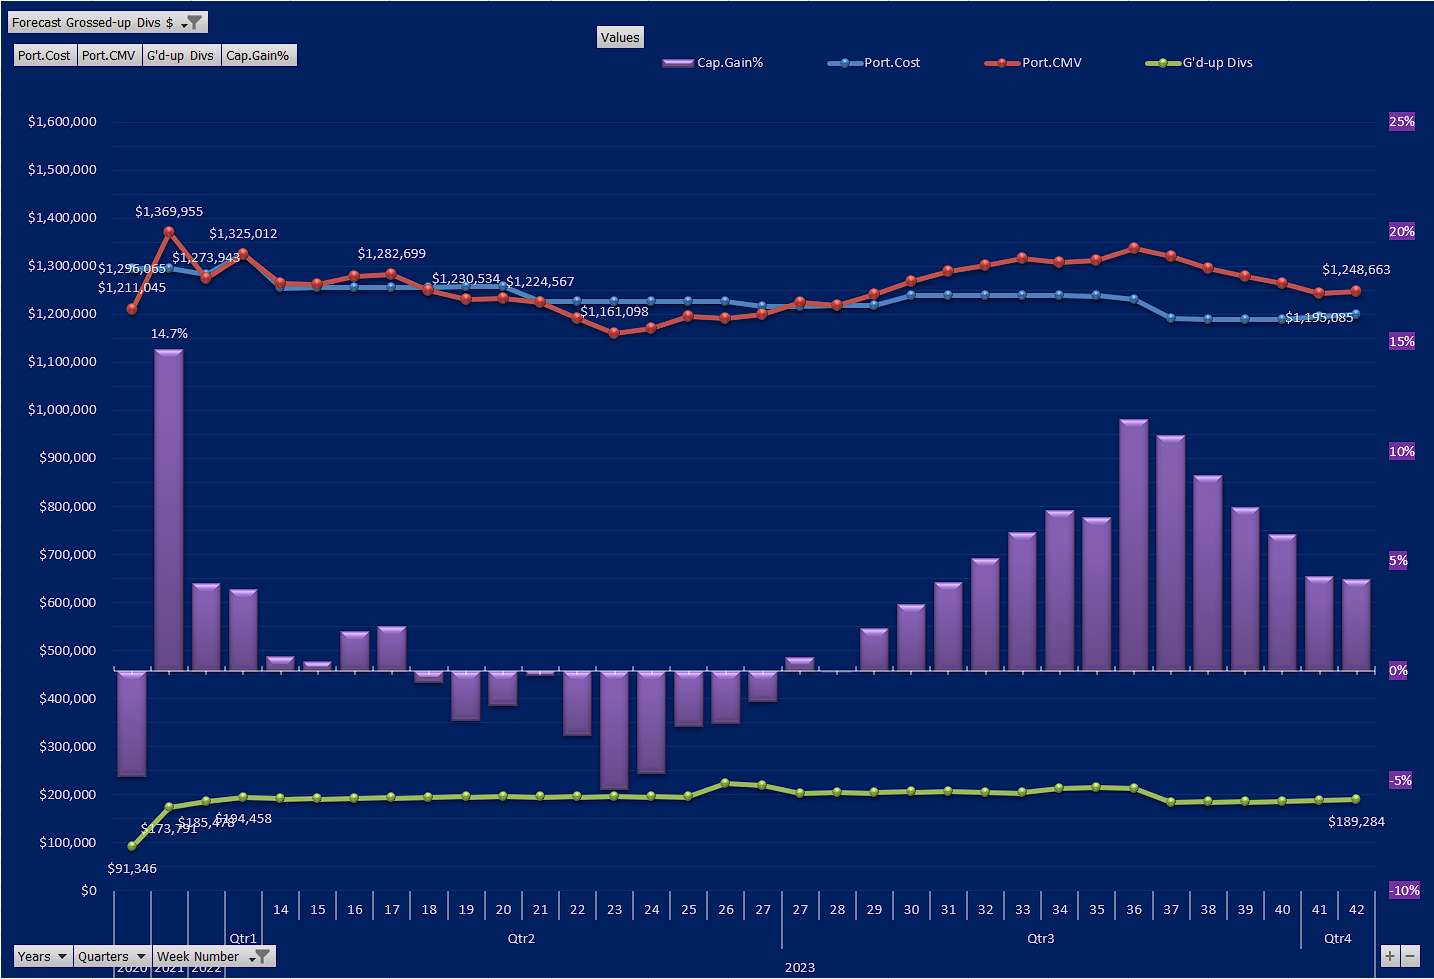
Once you have your Portfolio of Shares, ETFs or Bonds, you want to see how it is tracking against your Portfolio Aim mentioned earlier.
The following charts can be useful for this purpose.
To inquire about this system and how it might apply to you, please email us