When to Buy
A buy decision requires all buy criteria to be met simultaneously — not most of them, all of them. The most common trigger is a dividend announcement that confirms the forward yield will meet the target, combined with a current share price that satisfies the PE, EPS and capital gain criteria.
Timing around dividend announcements
The ideal buy window is between the dividend announcement date and the ex-dividend date. During this window you have maximum certainty — the dividend amount, franking percentage and ex-date are all confirmed facts, not forecasts. Buying before this window means relying on historical patterns and analyst estimates, which introduces avoidable uncertainty.
Criterion 10 — wait for the announcement. Do not buy in anticipation of a dividend. Historical yields are indicative, not guaranteed. A stock that paid 8.04% last year may pay less this year, or cut entirely. Waiting converts a forecast into a confirmed fact before you commit capital.
Position sizing
Position size is determined as a percentage of total portfolio value, calibrated to your confidence in and familiarity with the stock:
- Initial / trial position — 1% — first time buying this stock; building familiarity
- High risk — up to 5% — limited track record or higher volatility
- Medium risk — up to 10% — established track record, moderate confidence
- Low risk — up to 15% — long track record, high confidence, consistent yield
A LIC (Listed Investment Company) such as WAM Capital, which itself holds a diversified portfolio of ASX shares, can justify a higher weighting than an individual company because the LIC structure provides built-in sector diversification within a single holding.
Market Depth analysis
Rather than simply placing a market order, we analyse the ASX Market Depth data before placing a buy order. Market Depth shows every current buy and sell order, at what price, and in what quantity — information that is critical to achieving a good fill price.
The chart below converts the numeric Market Depth table into a chart, making it immediately clear where the large buyers and sellers are positioned. A large sell order at a specific price acts as a supply overhang — it will tend to cap the price near that level until the order is filled, which can be used to your advantage when setting a limit order price.
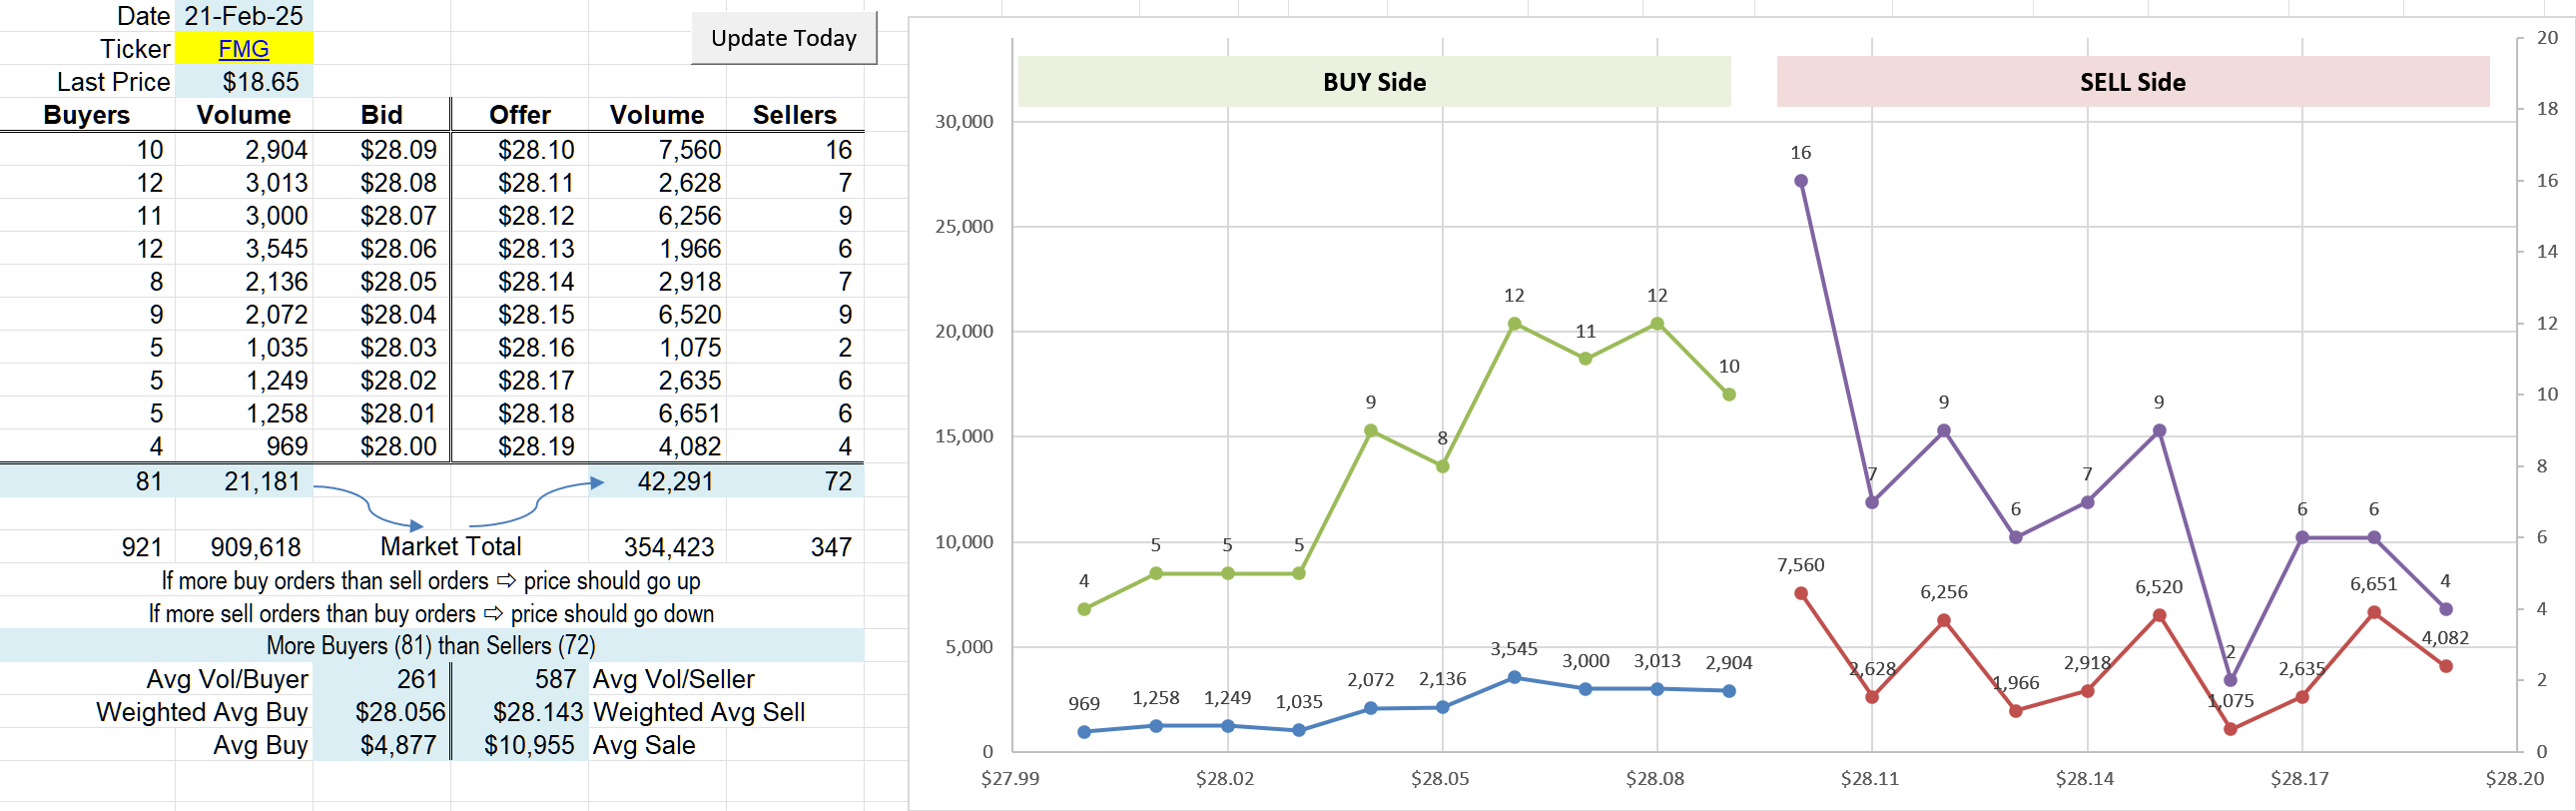
On 23 March 2026, before market open, a single seller had 148,000 WAM shares offered at $1.670 — by far the largest order in the depth. This supply overhang dragged the indicative opening price down from $1.685 to $1.670. A limit buy order was set at $1.685, knowing it would fill at the lower clearing price of $1.670. Both orders filled at $1.670 exactly as predicted at the 10am open — saving $0.015 per share against the pre-open limit price.
Grossed-up dividend yield over time
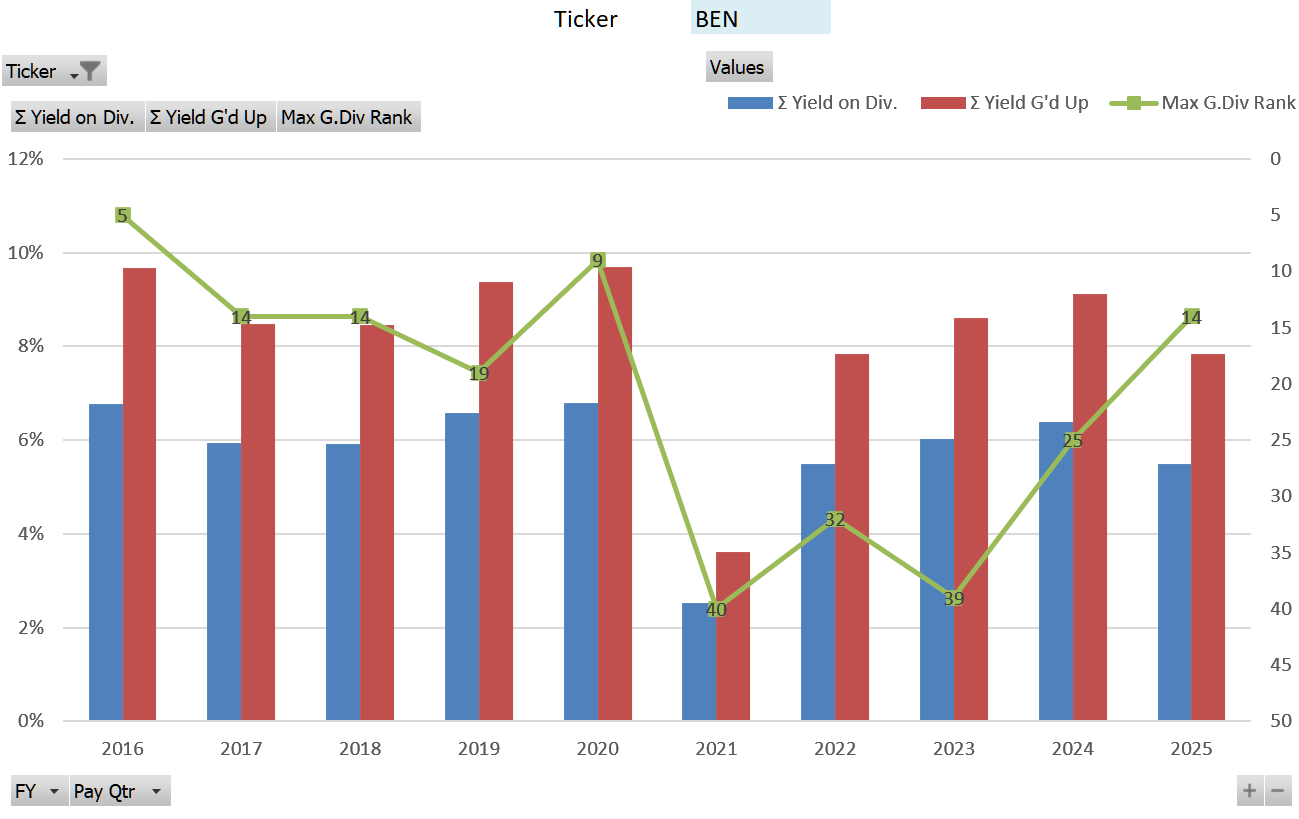
Rather than tracking share price alone, we track the grossed-up dividend yield at the ex-date price over time for each stock on the radar. This is more meaningful than the raw cash yield because it incorporates the franking credit value, giving a true picture of the total income return at each dividend event.
The chart overlays two reference lines across the full dataset for that stock:
- Average grossed-up yield (cyan line) — the long-run mean across all dividend events. A current yield above this line suggests the stock may be undervalued relative to its own history; below it suggests the price has run ahead of the dividend.
- Standard deviation (red line) — a single value representing the variability of the grossed-up yield across the entire dataset. A low standard deviation indicates a consistent, reliable income stock; a high value signals that yields have fluctuated significantly over time, increasing the risk of buying at what appears to be an attractive yield only to find it contracts shortly afterwards.
How to read this chart. Look for stocks where the current bar is above the average line (cyan) — they are yielding more than their own historical norm, which may indicate a buying opportunity. A low standard deviation (red line close to zero) confirms the income has been reliable over time. The purple line with numbered labels shows the stock’s grossed-up yield rank within the full radar at each point in time — a falling rank number means improving relative income performance.
Setting the buy price — the “5 tick” rule
Once you have decided to buy, set your limit order price 5 ticks below the current best ask price shown in Market Depth. This gives you a slightly better entry price while still being competitive enough to fill in normal market conditions. For a sell order, set it 5 ticks above the current best bid.
A “tick” is the minimum price increment for that stock — typically $0.001 for stocks priced below $2.00, and $0.005 for stocks above $2.00 on the ASX.